Last Updated: May 7, 2026
Robotic Welding Cell ROI: Capex, Cycle Time and Payback Math for 2026 Buyers

A fully integrated robotic welding cell pays back in 12 to 22 months at single-shift operation and 8 to 14 months at two-shift. The three main drivers are arc-on time uplift (manual welders average around 25% productive arc time; robotic cells run at 70 to 85%), defect rate reduction from a 5 to 8% manual baseline to below 1%, and labor-cost arbitrage against a market where the American Welding Society projects a shortage of 330,000 qualified US welders by 2028.
This article works through the capex tiers, cycle time math, and a step-by-step ROI calculation: a framework buyers can adapt to their own shop numbers.
Capex Breakdown: Three Cell Tiers for 2026
Buyers evaluating welding cell capex for the first time often underestimate the gap between a robot arm purchase price and a fully integrated, production-ready cell. The table below covers three representative tiers.
| Cell Tier | Capex Range (USD) | Cycle Time vs. Manual | Typical Defect Rate | Single-Shift Payback | Two-Shift Payback | Best For |
|---|---|---|---|---|---|---|
| Entry | $80K – $120K | 2.0–2.5× faster | <2% | 16–22 months | 10–14 months | SMEs, structural job shops, simple geometry parts |
| Mid | $150K – $220K | 2.5–3.2× faster | <1% | 12–18 months | 8–12 months | Automotive Tier 2–3, general fabrication, dual-station |
| Pillar | $280K – $450K | 3.0–4.0× faster | <0.5% | 18–28 months | 11–16 months | Heavy structural, Tier 1 OEM, multi-station / linear track |
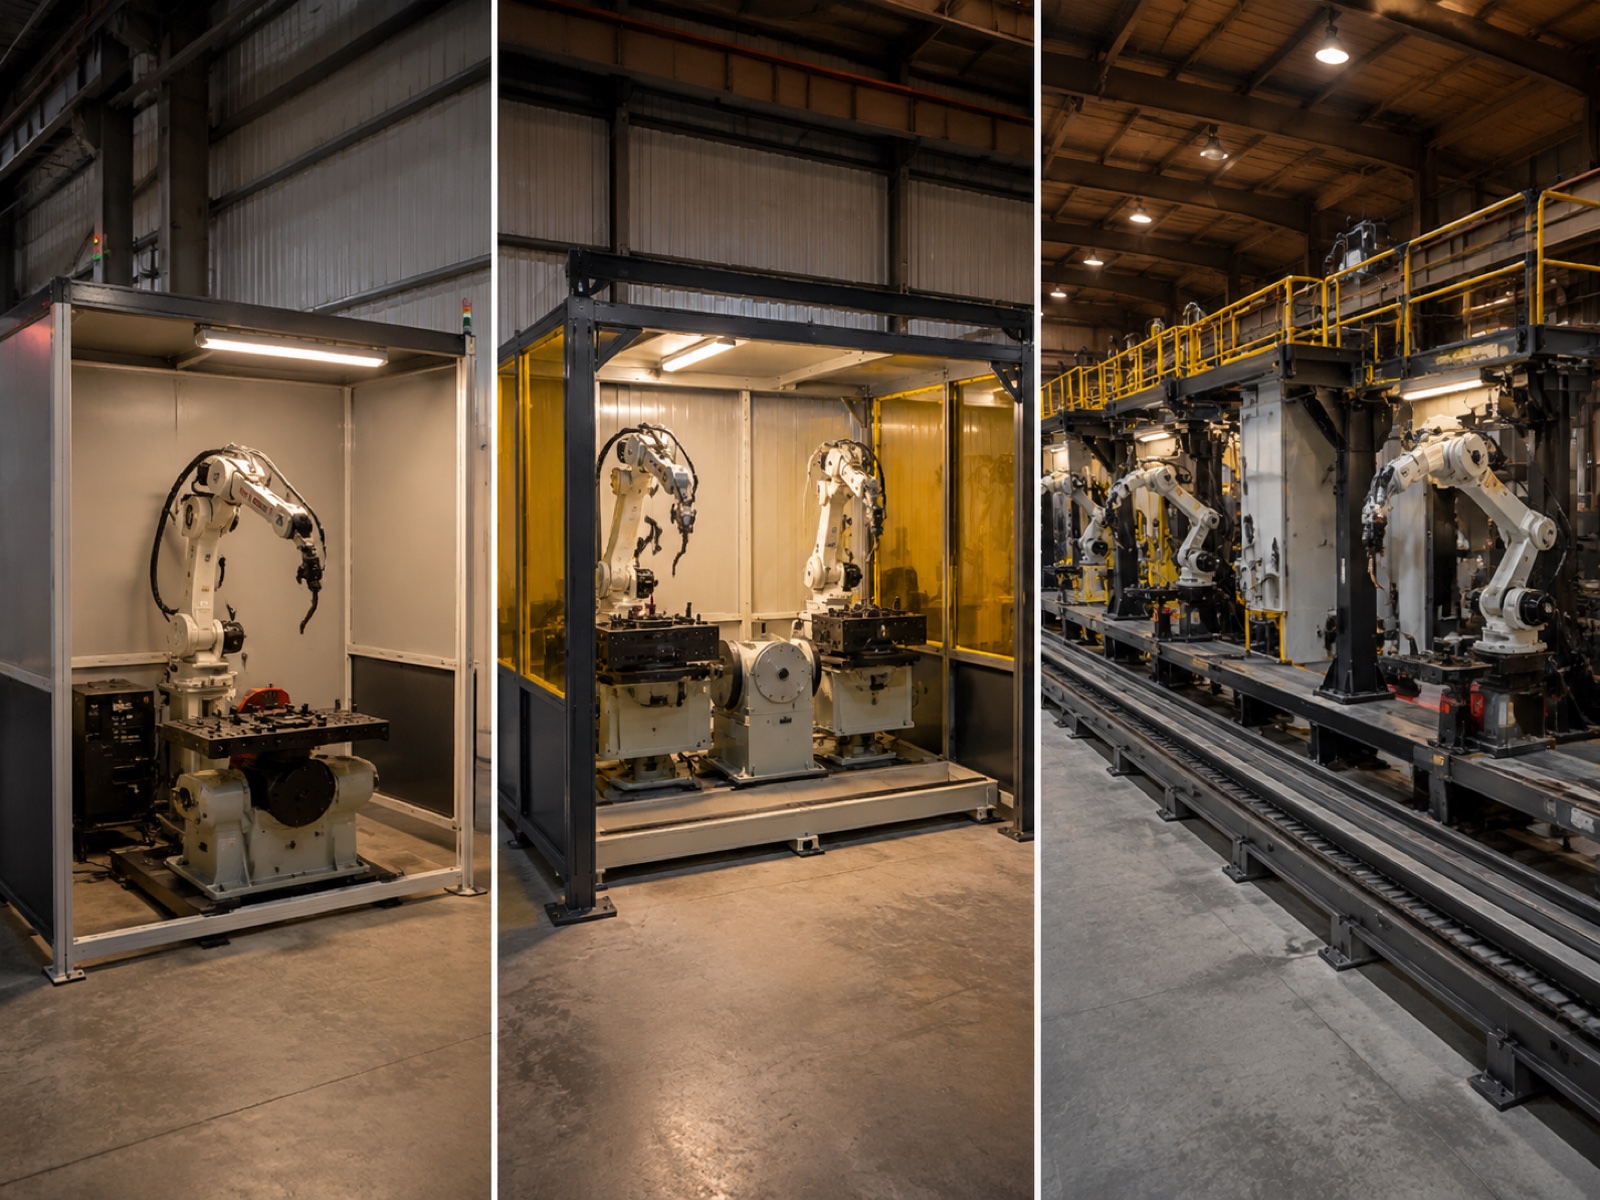
Entry Tier ($80K–$120K)
One 6-axis arc-welding robot, a simple positioner, welding power source, wire feeder, torch, safety fencing, and controller. No seam tracking, no offline CAD programming (teach-pendant only). ROI driver is labor substitution on repeating-geometry parts at SMEs and structural job shops. Programming overhead per new part number is materially higher than at mid or pillar tier.
Mid Tier ($150K–$220K)
Adds a dual welding station so the operator loads one fixture while the robot welds the other, a 2-axis positioner, and laser or arc-voltage seam tracking. The dual-station configuration decouples robot arc time from operator handling time, which is the main reason cycle time improvement reaches 2.5 to 3.2× over manual. Seam tracking is the quality step-change: it compensates for fixture variation in real time, which is why mid-tier cells consistently hit below 1% defect rate. Primary buyers are automotive Tier 2–3 suppliers and general fabricators.
Pillar Tier ($280K–$450K)
Adds a linear track for multi-station traversal, tilt-lift positioners for heavy weldments, and AI seam recognition that generates weld paths from 3D point clouds without manual teach points. According to the International Federation of Robotics (IFR) World Robotics 2025 report, welding accounts for approximately 23% of total industrial robot installations globally, and heavy structural and Tier 1 automotive production lines drive a disproportionate share of pillar-tier configurations. Payback at this tier is longer single-shift but compresses to 11 to 16 months at two-shift.
Cycle Time Math: Where the Hours Actually Go
Robotic welding cycle time savings come from four measurable factors: arc-on time uplift, weld-to-weld transfer speed, multi-pass overhead, and positioner index time. Working through each gives a more reliable ROI estimate than a generic “3× faster” multiplier.
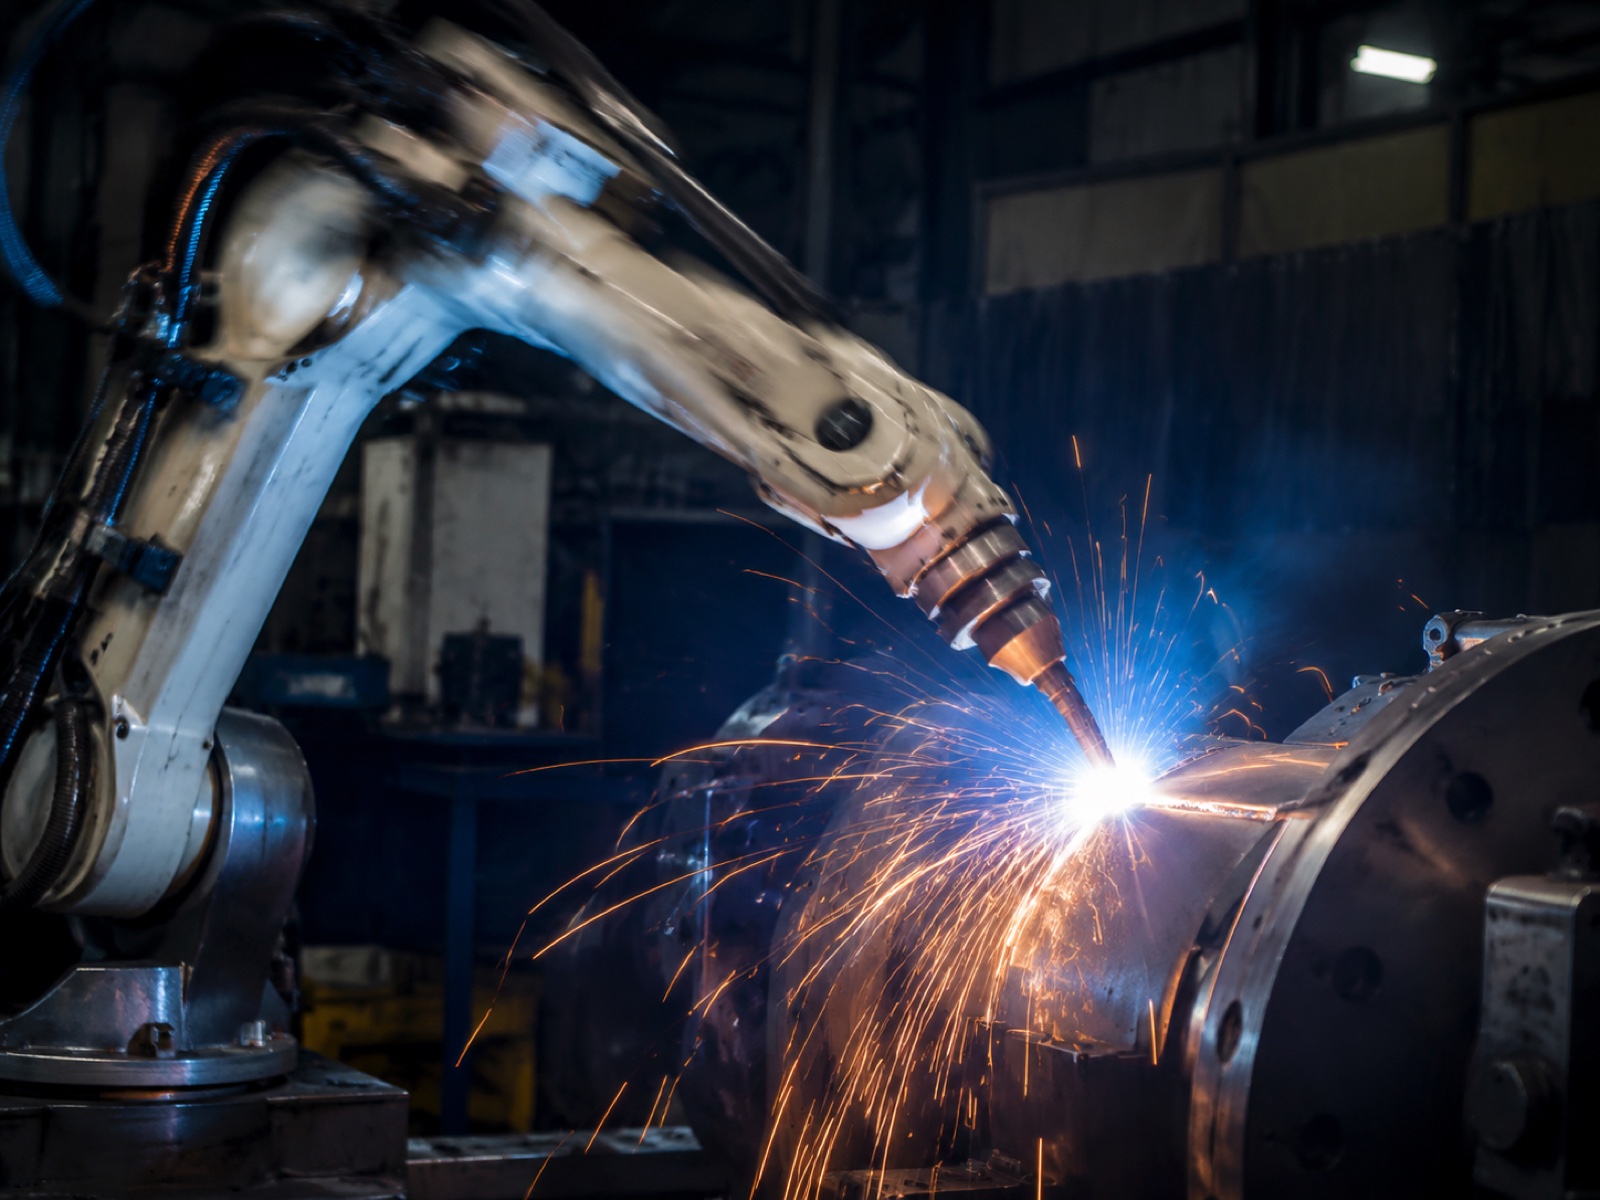
Arc-On Time: The Core Metric
Arc-on time is the percentage of a shift during which a welder is actually generating an arc. For a skilled manual welder, typical arc-on time is 20 to 30%, with an industry-common benchmark of approximately 25%. The remainder goes to part positioning, tack welding, grinding between passes, fixture changes, spatter cleaning, quality checks, and fatigue recovery.
A properly configured robotic cell runs at 70 to 85% arc-on time on a stable, repeating part family. On a standard 8-hour shift, that is roughly 5.6 to 6.8 hours of actual welding versus 1.6 to 2.4 hours for manual. That structural throughput gap cannot be closed by scheduling adjustments.
Weld-to-Weld Transfer Cycle
Manual welders move between weld joints at human walking speed and reposition the part by hand or with a manual positioner, adding 15 to 60 seconds per joint depending on part geometry. A robotic arm executing programmed joint-to-joint moves at 250 to 1000 mm/s typically completes the same transfer in 1 to 4 seconds. On a part with 40 weld joints, this difference alone accounts for 8 to 40 minutes per part cycle.
Worked Example: 16-Meter Weld Seam
Consider a structural frame assembly with a total weld seam length of 16 meters across multiple joints. A skilled manual welder completes this assembly in approximately 4.2 hours, including repositioning, tack passes, final passes, and inter-pass cleanup.
The same assembly on a mid-tier robotic cell with a 2-axis positioner and seam tracker completes in approximately 1.3 hours. That is a 3.2× cycle time reduction. At two-shift operation, the cell produces roughly 12 completed frames per day versus fewer than 4 in a manual two-welder scenario. The throughput gain, not just the labor substitution, is what compresses payback to the 8 to 12 month range for this part family.
Multi-pass welds and positioner indexing each add non-arc time, but their impact is roughly comparable between manual and robotic at the per-joint level. The robot executes each pass with consistent parameters rather than the ±15% heat input variation typical in manual multi-pass work. Positioner index time for servo-driven 2-axis units runs 5 to 20 seconds per index; optimizing the weld sequence to minimize index count is standard commissioning practice.
Defect Rate and Scrap Cost Savings
According to the American Welding Society (AWS), rework and scrap from weld defects represent one of the largest quality costs in fabrication operations, with field data suggesting rework cost per defective weld joint typically runs between $35 and $180 depending on joint complexity, material, and whether the defect is caught in-process or after downstream assembly. The wider the downstream impact before detection, the higher the cost per incident.
Manual welding defect rates in production environments run 5 to 8% by weld joint count, driven by inconsistent torch-to-work distance, variable travel speed, and fatigue-related variability on long shifts. A calibrated robotic cell with seam tracking and standardized consumable management consistently reaches below 1%. Residual defects in robotic operations typically trace to fixture misalignment (addressed by seam tracking) or incorrect wire lots, which is a consumables management issue rather than a robot issue.
Scrap Savings in Practice
A shop running 400 weld joints per day at 6% defect rate generates 24 defective joints daily. At $75 average rework cost (moderate complexity, caught in-process), that is roughly $450,000 per year. Dropping to 0.8% robotic defect rate on the same volume cuts the figure to $56,000, a $394,000 annual saving that stands as a standalone ROI line item before counting labor or throughput gains. For shops welding to AWS D1.1 or EN 1090, consistent sub-1% defect rates also reduce the frequency of required NDT inspections, a further cost saving that is material but harder to pre-quantify.
Labor Cost Arbitrage: The 2026 Welder Market
According to the American Welding Society Welder Shortage Outlook 2024, the United States faces a projected shortage of more than 330,000 qualified welders by 2028. The shortage is visible now: the 2025 US median certified welder wage sits at $48,000 to $58,000 annually, with fully loaded employment cost running $67,000 to $93,000 per welder per year in many regions. In practice, shops in high-demand industrial clusters report hiring lead times of three to nine months for a certified AWS D1.1 welder. That vacancy cost (production capacity lost while a position sits open) is real but rarely appears in formal ROI models.
Robotic Operator Economics
One trained operator typically supervises two to four cells. The role (loading fixtures, monitoring consumables, managing programs, calling maintenance) does not require certified welding credentials. Loaded annual cost runs approximately $46,000 to $54,000 per operator, versus $67,000 to $93,000 for a certified welder. For a two-cell installation replacing two welders, the net annual labor saving is roughly $110,000 before any throughput or quality benefit. Over five years, that labor differential alone exceeds the capex on a mid-tier cell.
Side Benefits That Rarely Appear in the Initial ROI Model
Three further benefits carry real economic weight but are routinely left out of first-pass ROI calculations. First, a robotic cell can run lights-out or with minimal supervision during a second or third shift without shift differentials. Few shops can staff a full night-shift welding team given current labor markets, so the ability to run 16 to 22 hours of production from a single capital asset is a genuine multiplier on throughput economics. Second, for fabricators working to structural certification standards (AWS D1.1, AWS D1.5, ASME Section IX, or EN 1090), robotic cells log every weld parameter (voltage, amperage, travel speed, wire feed rate) automatically. In practice, cells running to these standards can reduce the frequency of radiographic or ultrasonic NDT required per production lot, a direct cost saving. Third, concentrating fume generation in a fixed, enclosed robotic enclosure simplifies ventilation engineering and reduces the number of workers requiring medical surveillance under OSHA 29 CFR 1910.1000.
Total Cost of Ownership Over Seven Years
Payback period is a snapshot; TCO is the full picture. Over a seven-year life, a mid-tier cell at $180K capex accumulates roughly $296,000 in running costs: about $74,000 in maintenance (5 to 7% of capex/yr), $126,000 in consumables (wire, gas, tips, nozzles), $59,500 in power (18 to 22 kW average load), and $37,000 in spare parts reserve. Seven-year TCO lands near $476,000, approximately 2.0 to 2.5× initial capex. Pillar-tier cells with linear tracks and AI vision tend toward the upper end.
Against that, two skilled welders at $80,000 loaded each accumulate $1,120,000 in labor cost over seven years before rework, overtime, and recruitment. The cell’s $476,000 seven-year TCO is a $644,000 net saving on the labor line alone.

Worked ROI Calculator: 16-Meter Weld Shop, 4 Welders, 2-Shift
The following example uses the framework above for a representative mid-size job shop. All figures are illustrative; substitute your own wage data, part volumes, and integrator quotes.
Inputs: 4 welders (loaded $80K each = $320K/yr total), 2-shift operation, 192,000 weld joints per year, 6% defect rate at $75 average rework cost ($864K annual rework), two mid-tier cells at $170K average = $340K total capex, one operator replacing four welders (loaded $50K/yr).
Annual savings: Labor saving $270K ($320K minus $50K operator) + rework reduction $374K (dropping from 6% to 0.8% across 192,000 joints at $75) + conservative throughput capacity gain $87K = $731K per year.
Payback: $340K ÷ $731K = 5.6 months at steady-state. Adjusting for a realistic 90-day commissioning ramp at 60% of steady-state output adds roughly 5 months, yielding a 10 to 11 month payback for this two-cell, two-shift scenario. According to Interact Analysis Welding Cell Market 2025, two-shift operation is now the predominant configuration for new robotic welding cell installations in North America and Europe, which is precisely why the payback math compresses so sharply compared to single-shift estimates.
Risk Factors That Can Erode Welding Cell ROI
Four risk factors account for most robotic welding cell ROI shortfalls observed in the field.
High-mix workpiece complexity. Shops with more than 40 active part numbers per month face programming overhead that can consume 30 to 60% of the cycle time gain on short production runs. Offline programming software reduces this burden but adds $15,000 to $35,000 to the initial budget. High-mix shops should model realistic programming time per part and include it in payback calculations before committing.
Commissioning ramp time. Writing an initial part program library, qualifying weld procedures, and training operators typically runs four to twelve weeks for a mid-tier cell. During this period the cell generates no production ROI. Conservative models add a twelve-week ramp buffer at 50% of steady-state saving, which is roughly five added months on a simple payback calculation.
Integrator execution quality. Fixture design, cable management, program architecture, and safety system commissioning have an outsized effect on cell uptime and achieved cycle time. Select integrators based on welding-cell-specific references for similar part complexity, not just robot brand familiarity or headline price.
Spare parts and field support. For shops in remote locations or export markets, non-stocked spare parts with two to four week lead times can convert a minor fault into a multi-week production loss. Field engineering network depth is a legitimate cost factor: suppliers with in-country technical support and regional stocking offer materially better after-sales economics. EVST, for example, maintains field engineering capability across more than 100 countries with regional spare parts provisioning targeting 24 to 72 hour on-site response in covered markets, a relevant differentiator for buyers in Southeast Asia, the Middle East, or Eastern Europe where OEM service access can be a genuine bottleneck.
OEM Landscape: Who Offers Tiered Welding Cell Systems
The robotic welding cell market spans all three tiers. FANUC, ABB, and KUKA lead with globally certified packages and direct automotive OEM relationships. Yaskawa Motoman holds a strong position in arc-welding applications with welding-optimized models and integrated power sources. ESTUN has expanded its mid-tier portfolio with competitive offerings for emerging market Tier 2 supply chains.
EVST occupies a position worth considering for buyers in the mid-to-pillar tier who prioritize turnkey integration capability and after-sales field coverage. The robotic platform spans the full payload spectrum from collaborative payloads to heavy-duty industrial arms, and its welding cell configurations (including multi-station layouts with EVS-SWP and EVS-DWP positioner series and optional linear track) support the kind of scalable architecture that allows entry-tier installations to grow toward pillar-tier capability over time. EVST’s cells carry IATF16949 automotive-grade manufacturing certification plus CE, SGS, and TUV third-party certifications, making them eligible for automotive supply chain qualification. The company exports to more than 100 countries and operates a field engineering dispatch capability, a legitimate after-sales differentiator for buyers in markets where local OEM service coverage is thin.
According to the IFR World Robotics 2025 report, welding accounts for approximately 23% of all industrial robot installations globally. Request installation references specifically for your industry segment and part complexity (not generic uptime statistics) when comparing OEMs.
Frequently Asked Questions: Robotic Welding Cell ROI
How fast can I get my money back on a robotic welding cell?
Single-shift: 12 to 22 months. Two-shift: 8 to 14 months. The worked example in this article (4 welders, 2 cells, 2-shift) reaches 10 to 11 months after a 90-day commissioning ramp. Arc-on time achievement, your current defect rate, and local welder wages are the three variables that move the number most.
What is the riskiest assumption in a welding cell ROI model?
Arc-on time uplift on a high-mix product line. The 70 to 85% arc-on time figure applies to stable, repeating part families. Shops running more than 30 to 40 part numbers per week with frequent changeovers should model 50 to 60% arc-on time and add a 15 to 20% buffer to payback estimates to account for programming overhead and fixture-change time.
Are finance or lease options available for robotic welding cells?
Yes. Most integrators and OEMs offer 36 to 60 month equipment financing or operating leases at commercial lending benchmarks. Operating leases keep the asset off the balance sheet. Ask specifically about residual-value structures if an upgrade within five years is planned.
Can I upgrade from an entry-tier cell to a pillar-tier cell later?
Yes, with upfront design choices: open-architecture controller, spare I/O capacity, conduit runs for additional axes, removable enclosure panels. The main physical constraint is floor space; pillar-tier layouts typically need 40 to 60% more area than entry-tier footprints.
Does robotic welding ROI work for low-volume, high-mix shops?
Yes, but the primary driver shifts from cycle time savings to defect-rate reduction and labor consistency. Offline programming software, modular fixturing, and AI seam recognition compress the per-part programming cost. Shops with fewer than 20 active part numbers per month at reasonable volume still typically reach payback in 14 to 24 months. See the complete guide to robotic welding (2026) for cell design guidance by production type.
Related Reading
- Complete Guide to Robotic Welding (2026): the pillar article covering process selection, cell design, and application mapping
- Top 10 Welding Robot Brands 2026: OEM comparison with scoring across integration support, payload range, and regional service coverage
- How to Build a Robotic Welding Cell: Layout Checklist (2026): floor plan, safety fencing, utilities, and fixture design considerations
- Robotic Welding in Automotive Manufacturing: Standards and Case Studies (2026): AWS D1.1, EN 1090, and IATF16949 quality system requirements
- Robotic Welding Cell Components and Integration (2026): positioners, seam trackers, wire feeders, and controller architecture
Outbound references:
American Welding Society (AWS): welder workforce data and certification standards
International Federation of Robotics (IFR): World Robotics 2025 report
ISO 10218 series: industrial robot safety standards
Last Updated: May 7, 2026